
KJIPUKTUK (Halifax) – The newest provincial welfare stats are in: In Nova Scotia in 2018 the very poor get poorer once again.
Each year Maytree releases a Welfare in Canada report, showing total incomes of people in welfare across Canada.
Total income here means the social assistance income, plus whatever tax credits and child benefits recipients qualify for.
The report looks at four example households in each province.
- Single person considered employable
- Single person with a disability
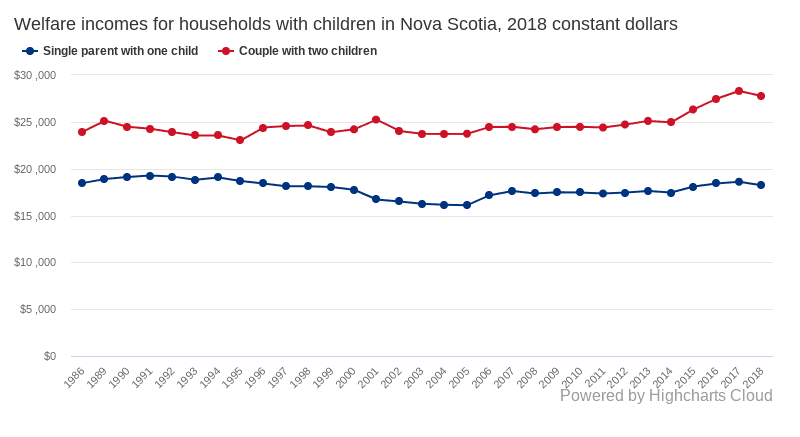
- Single parent with one child age two
- Couple with two children ages 10 and 15
In Nova Scotia all four example households are on a downward slope relative to the previous years. In other words, people on social assistance are getting poorer.
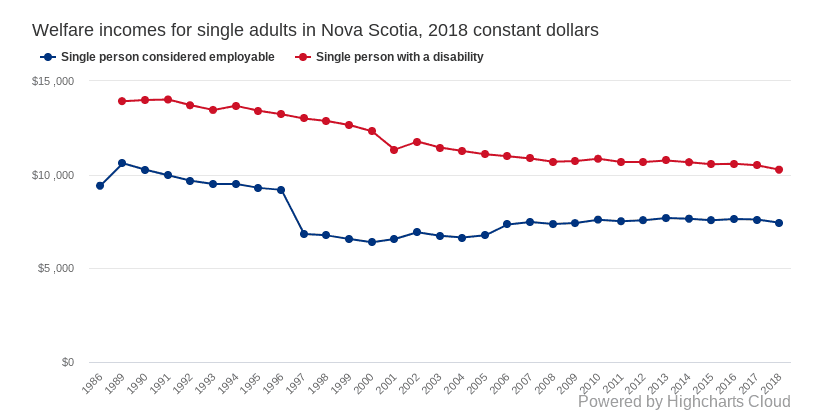
From 2015 to 2017, the maximum welfare incomes of households with children rose, largely as a result of changes to federal child benefits. In 2018, the welfare incomes of both household types decreased again.
So how do these dollar figures translate into real world living conditions?
There are several ways people measure poverty. The Market Basket Measure or MBM) is based on the cost of a specific basket of goods and services representing a modest, basic standard of living. MBM includes the cost of food, clothing, footwear, transportation, shelter and other expenses. It’s not a perfect measure, but it’s useful nonetheless.
Here is the table that compares what you need to meet that basic standard of living, and what you actually receive. The scenarios apply to people who live in Halifax, because MBM is calculated on a community basis.
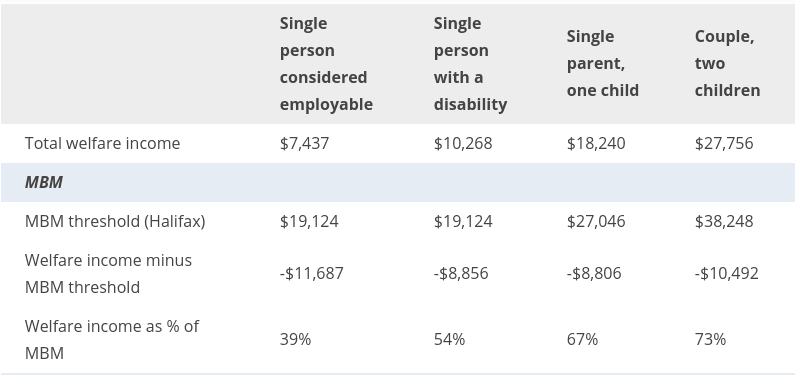
The gap between what you need and what you get is huge.
A single person deemed employable receives only 39% of what she should receive to live a half-decent life! A person with a disability only gets slightly more than half that amount, and is short $8,856 per year!
Even a couple with two children, comparatively well-off in Nova Scotia, only receives 73% of what is required and should receive an additional $10,400!
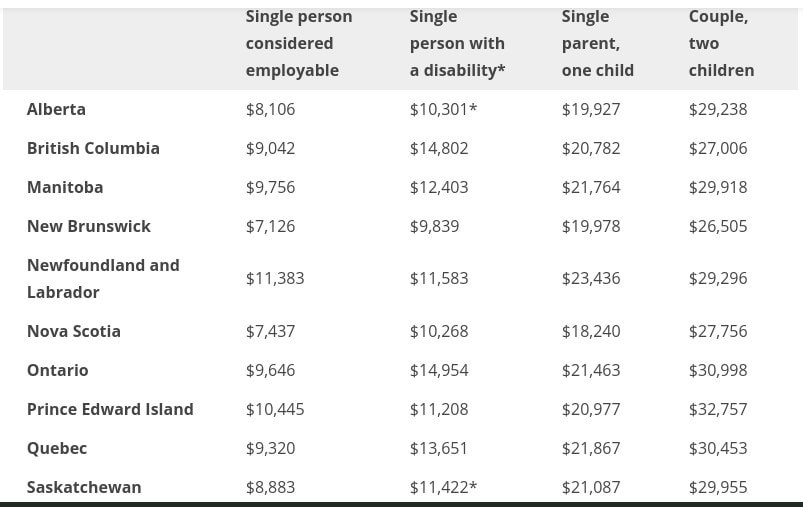
This is the saddest graphic of all. It shows how Nova Scotia compares to other provinces .
Well, we are lowest for the single employable individual, lowest for the individual with a disability, lowest for a single parent with one child, but wait, we’re only third lowest for the couple with two kids.
I have been writing these stories since my Halifax Media Co-op days. They’re always very depressing, especially when you consider how year after year the Joanne Bernards and Kelly Regans of this world assure us things would get better.
And it never happens.
Note: An earlier version of this article incorrectly suggested that the numbers in the Maytree report did not reflect inflation. Corrected on November 18, 2019, 13:40 pm.
See also: Welfare recipients keep getting poorer in Canada’s most miserly province
With a special thanks to our generous donors who make publication of the Nova Scotia Advocate possible.
Subscribe to the Nova Scotia Advocate weekly digest and never miss an article again. It’s free!


What can we do to help change it?