KJIPUKTUK (Halifax) – Adjusted for inflation Nova Scotians on welfare have seen no improvements over the last 30 years, and in real dollars many are much worse off than they were in the nineties.
That’s one of the conclusions in the Welfare in Canada, 2016 report issued today by the Caledon Institute of Social Policy.
The report looks at incomes of four different households living on social assistance, also taking into account provincial and federal child benefits and tax credits.
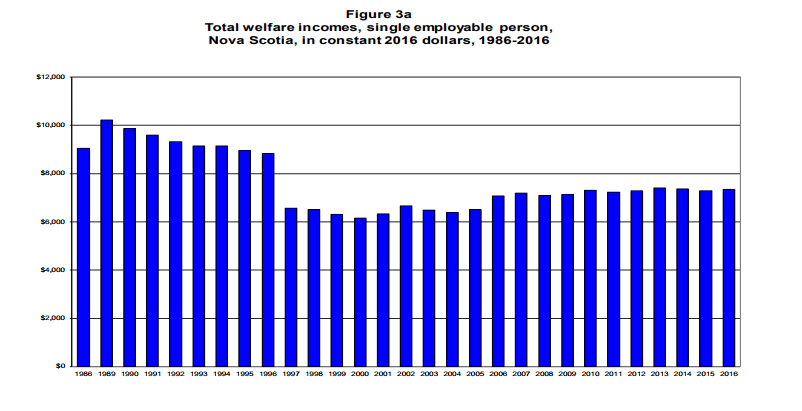
Single welfare recipients took an especially big hit since the early nineties. Incomes dropped substantially from a ‘high’ of $10,216 in 1989 down to a low of $6,159 in 2000. In 2016 their income was $7,349.
Note that in Nova Scotia welfare was a municipal responsibility until 1997, and the report uses Halifax numbers, which were higher than elsewhere in the province.
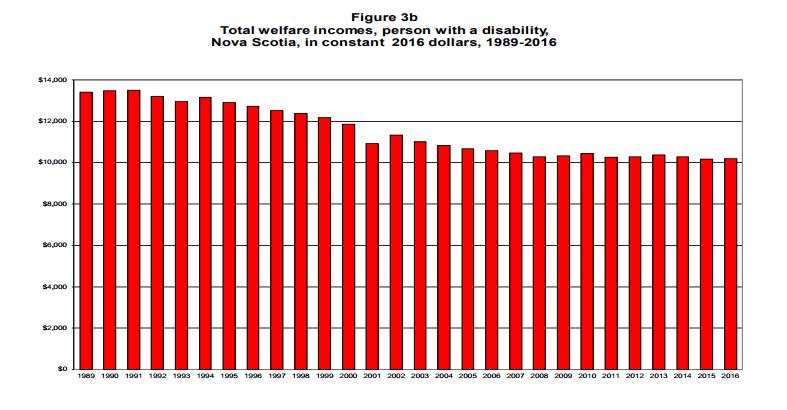
 Single persons with disabilities also took a hit over the decades. Welfare incomes began the period at $13,410 in 1989 but decreased substantially to finish the period at $10,181.
Incomes for single parent families with one child went up and down a bit over the years, but didn’t show much of an upward or downward trend. They started the period at $17,758 in 1986 and ended at $17,727 in 2016.
Two-parent families with two children ages 10 and 15 similarly fluctuated between $23,000 and $24,000 between 1986 and 2014, but at that time things improved marginally. That family now receives $26,429.
The report also asks the question how adequate these amounts are. One benchmark that is frequently used in those types of calculations is the the Market Basket Measure (MBM.)
MBM is based on the cost of a specific basket of goods and services representing a modest, basic standard of living. It includes the cost of food, clothing, footwear, transportation, shelter and other expenses.
Here is the table that compares what you really need and what you actually get.
| HALIFAX | Total welfare income | Estimated 2016 MBM | Poverty gap | Welfare income as % of MBM |
| Single employable | $7,349 | $19,125 | -$11,776 | 38.4% |
| Person with disability | $10,181 | $19,125 | -$8,944 | 53.2% |
| Single parent, one child | $17,727 | $27,046 | -$9,319 | 65.5% |
| Couple, two children | $26,429 | $38,249 | -$11,820 | 69.1% |
How to read this chart: For instance, when you’re a single person with a disability you receive $10,181 in welfare and tax credits. But to live a half decent life you really need $19,125. So you’re short $8,944, and you only receive 53% of what you actually need.
If you can, please support the Nova Scotia Advocate so that it can continue to cover issues such as poverty, racism, exclusion, workers’ rights and the environment in Nova Scotia. A pay wall is not an option, since it would exclude many readers who don’t have any disposable income at all. We rely entirely on one-time donations and a tiny but mighty group of dedicated monthly sustainers.


I haven’t been on welfare for almost 5 years..I’ve become self sustainable however right in this moment as I’m typing this message i am waiting for a call from the Department of Community Services as i have an over payment with them..they refuse to give me any kind of statement or invoice as to the money i allegedly owe. My over payment went from 6 grand to 17 grand and they wont give me an explanation..what I can say is I was a single mother with 4 children receiving no child support!! That my debt is largely related to helping me with power bills and food but instead of giving me the information I requested they are asking Revenue Canada to garnish any income tax refunds and GST to recover a debt I didn’t receive a bill for. Getting to the point where I don’t know where to turn next!! Frustrated!!